
HOW TO INCREASE THE USE OF GRAPHICS IN BRIEFS
Part 1 of this article discussed using graphics in briefs only as an abstract concept. For guidance on how one might decide whether to use a graphic in a brief for a particular point, there is an excellent law-review article by Steve Johansen and Ruth Anne Robbins, “Articulating the Analysis: Systemizing the Decision to Use Visuals as Legal Reasoning.”1
The authors helpfully divide graphics into three categories: organizational visuals such as bullet lists, timelines, and tables (even the Table of Contents); interpretive visuals such as flowcharts, pie charts, and Venn diagrams; and representative visuals such as images and maps. They then ask writers to imagine the legal argument visually and identify what type of graphic would aid the reasoning.2
Once the writer has decided to use a graphic in the brief, Johansen and Robbins suggest, it’s still beneficial to assess where the graphic would fall along a “usefulness” continuum: on one end are decorative graphics that are visually interesting but that have a limited connection to the analysis; on the other are transformative graphics — they have a purpose as part of the legal reasoning and serve as a form of visual analysis.3
Purely decorative graphics would be nixed; transformative graphics would go in.
Consider some types and examples of graphics.
Here are two simple ways to use one type of graphic — images — in briefs, as recommended by survey respondents:
- I mostly use screenshots of the contractual or other language I’m interpreting.
- Many of mine are labeled photos — essentially, evidentiary documents but placed in the body text rather than in an appendix.
But there are other ways. Shown here are some simple examples writers can consider that would not be difficult to create. These graphics come from examples sent to the author, from other sources, and from another excellent article on graphics by Adam L. Rosman: “Visualizing the Law: Using Charts, Diagrams, and Other Images to Improve Legal Briefs.”4
Graphics in briefs can be as simple as the following table showing who held what position in a corporation.5 The information here is more quickly and easily grasped than if it were conveyed in textual format.

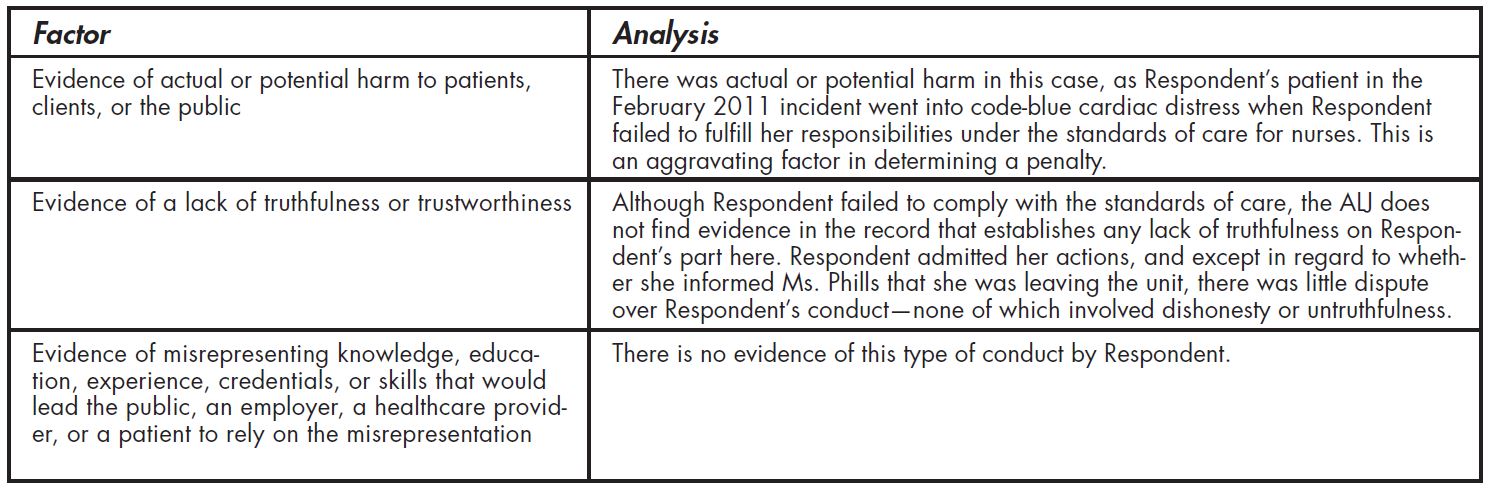
The following portion of a larger table was used to address a 12-factor legal test as applied to a set of facts. This is a good example of a graphic that makes digesting the analysis easier when compared to a traditional-text format. (Note: because of the single-column format, the first two examples below are more spread out horizontally than would normally appear.)
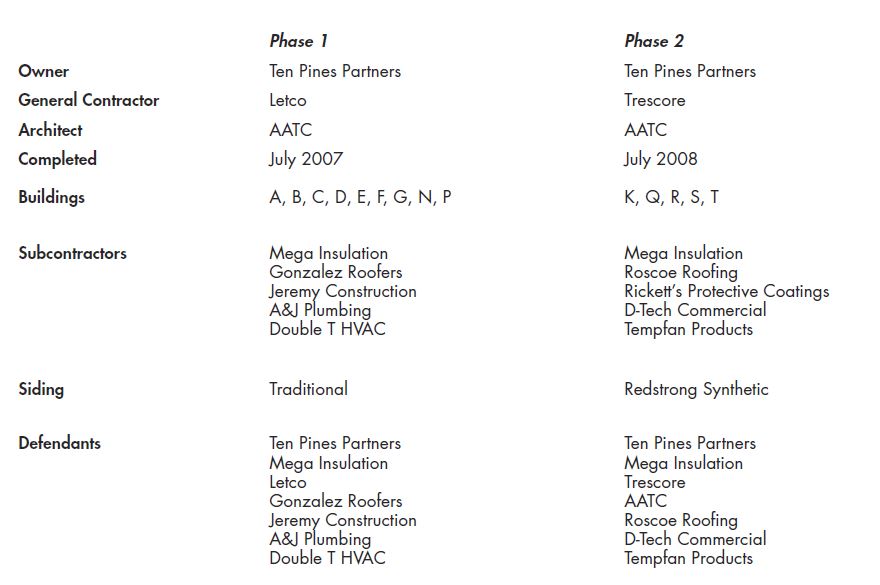
This next chart appeared in a response to a plaintiff’s motion to consolidate. It was the writer’s attempt to emphasize that although the same party owned the two apartment-complex phases at issue, the buildings, subcontractors, and materials differed substantially, and the two cases would not require the same evidence. After attempting to describe the content in textual paragraphs, the writer decided to use this chart:
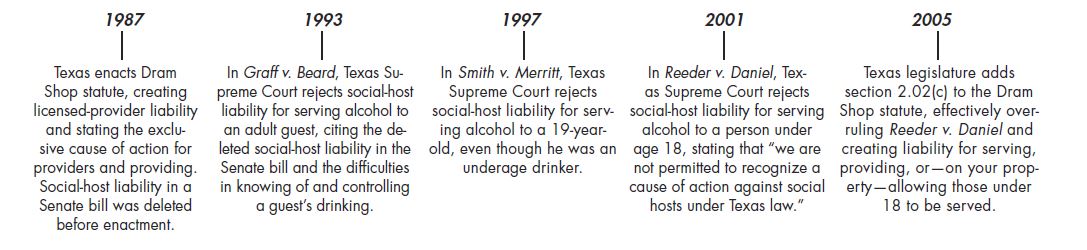
This timeline conveys key events in the evolution of social-host liability for serving alcohol under Texas law.
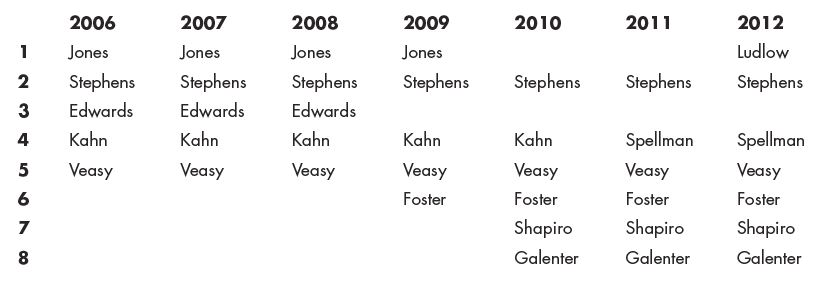
Here’s another timeline, showing membership on a board of directors over time.6
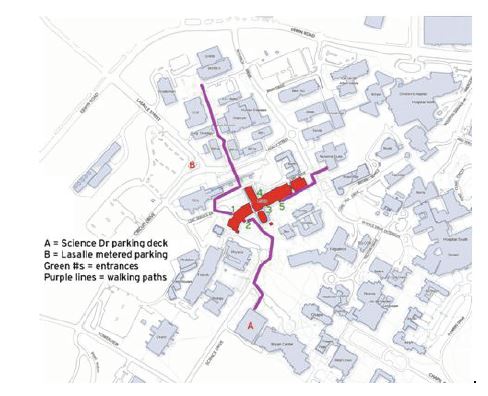
Maps can be particularly helpful as graphics in disputes relating to locations, in boundary disputes, and for other geographically related information.7
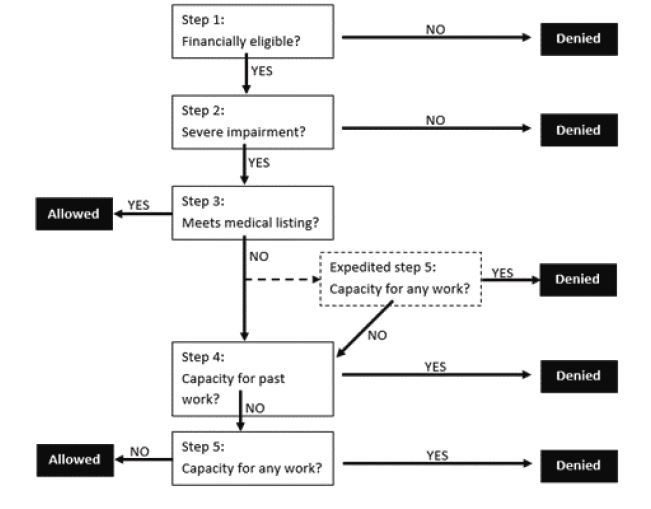
A flowchart can simplify what in the abstract seems like a complex decision.8
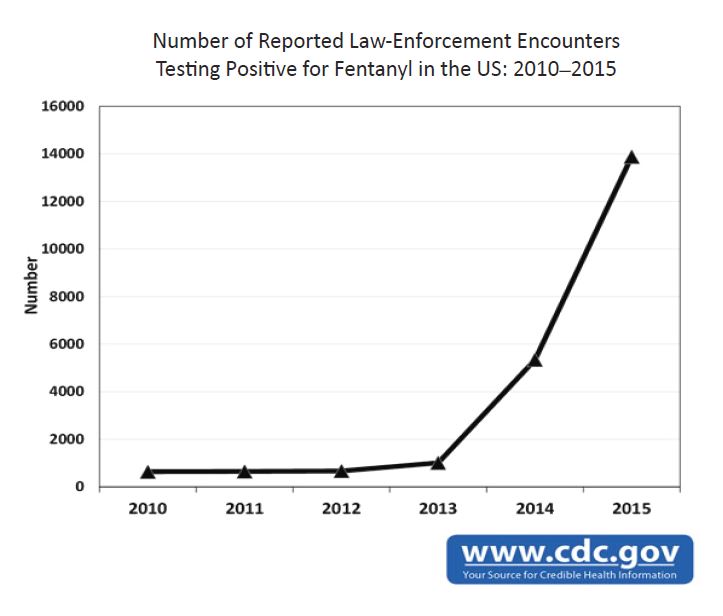
Traditional charts (such as the pie chart in Part 1 of this article) and graphs can work, too. Here’s one depicting the number of
reported law-enforcement encounters testing positive for fentanyl in the United States.9
Consider, or reconsider, using graphics in a brief.
These examples may give you some ideas, but it’s up to you to consider the information or analysis and decide whether a graphic is right for your brief. Think creatively, get some help, improve your skills, and recognize that judges are generally favorably disposed to graphics in briefs. Then try it.
This article originally appeared in 92 The Advocate 8 (Fall 2020). Reprinted with permission.